by Pew Research Center
With less than 50 days until the 2018 congressional elections, Democrats hold a 10-percentage-point advantage over Republicans on the generic ballot among all registered voters.
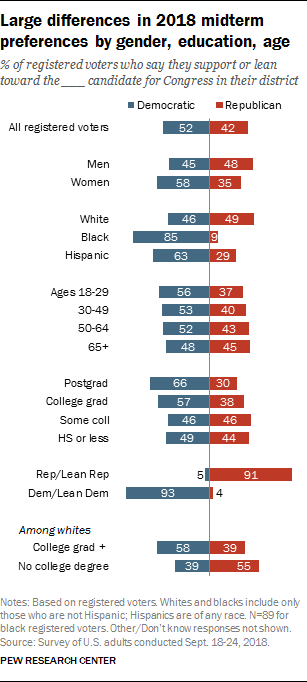 Today, 52% of registered voters say they support or lean toward the Democratic candidate for Congress in their district, while 42% say they prefer the Republican candidate.
The share of voters who say they support or lean toward the Democratic candidate is slightly higher than it was in June (48% then, 52% today), while the share who back GOP candidates is little changed (43% then, 42% now).
Today, as in earlier surveys, there are wide differences in voting preferences by gender, race, education and age.
Democratic candidates have a 23-point edge over Republican candidates among women voters (58% to 35%). By contrast, men are roughly evenly divided in their preferences: 48% of men support the GOP candidate, 45% say they prefer the Democratic candidate.
White voters are about evenly divided in their preferences (46% favor the Democratic candidate, 49% favor the Republican candidate), while black voters overwhelmingly back Democrats. Hispanic voters continue to favor Democratic candidates by about two-to-one (63% to 29%).
While those ages 50 and older are split in their choice of candidate, Democrats have a significant edge among younger voters.
Education is also associated with voter preferences: Those with a college degree or more favor Democratic candidates by a wide margin (59% to 36%), while those with no college degree are roughly evenly split (45% favor the GOP candidate in their district, while 48% favor the Democratic candidate.)
Voters express record high levels of enthusiasm for a midterm
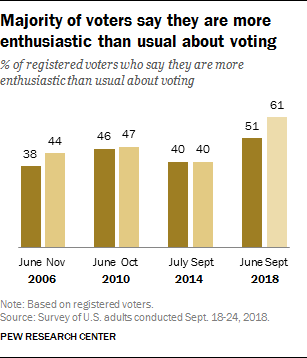 As the election approaches, a growing share of voters say they are “more enthusiastic than usual about voting” – and the share expressing this is now substantially higher than in any midterm election since the question was first asked two decades ago.
In June, 51% of registered voters said they were more enthusiastic than usual. Three months later, 61% say this, which is 14 points higher than the prior high for this measure (47% in October 2010).
Today, only 22% of voters say they are less enthusiastic about voting than usual – no fewer than three-in-ten said this in prior midterms – while 14% volunteer that they feel about as enthused as in previous congressional elections.
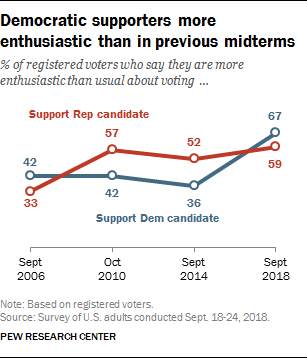 Among those who support Democratic candidates, reported levels of enthusiasm are much higher than in past midterm years: Two-thirds (67%) say they are more enthusiastic than usual; by contrast, fewer than half said this in midterms dating back to 2006. Among GOP voters, 59% say they are more enthusiastic than usual about voting – on par with the share saying this in October 2010 and modestly higher than in 2014.
The share of voters saying they are following news about candidates and election campaigns very or somewhat closely has increased substantially from June. Today, about seven-in-ten voters (72%) say they are following election news at least somewhat closely compared with about six-in-ten (59%) in June.
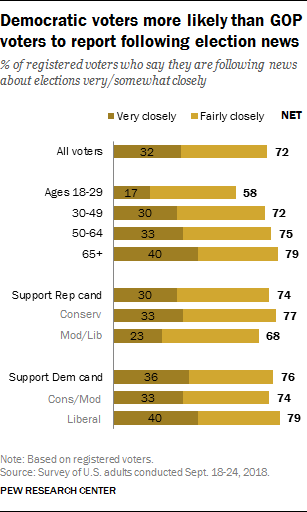 This increase in attention is most pronounced among those who say they are supporting the Democratic candidate in their district. In June, supporters of Republicans and Democrats were about equally likely to say that they were following election news very closely (24% of Republican voters and 23% of Democratic voters), but today Democratic voters are more likely than Republican voters to be following election news very closely (30% of
  Republican voters compared with 36% of Democratic voters).
For most voters, Trump looms large in their congressional vote
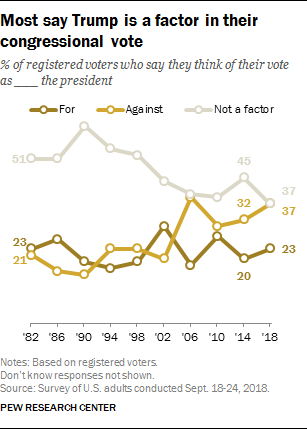
Overall, six-in-ten voters (60%) say that Trump will factor into their vote for Congress this fall. This is larger than the share of voters who said Barack Obama would factor into their 2014 congressional vote choice, but similar to the percentage who named Obama in 2010 or George W. Bush in 2006 at similar points in those election years.
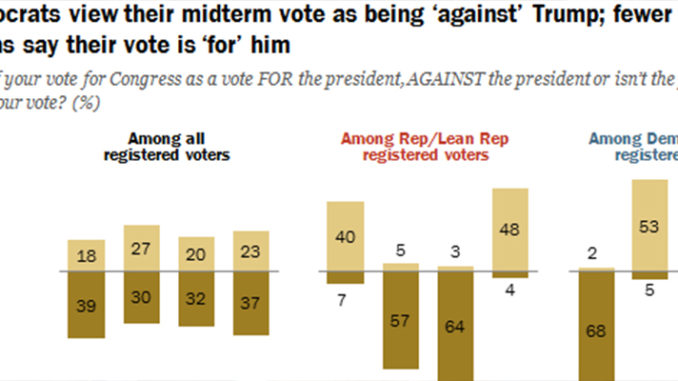
More than a third of voters (37%) say they consider their congressional ballot as a vote against Trump, while about a quarter (23%) say they consider it a vote for Trump.
About two-thirds (66%) of Democratic and Democratic-leaning voters say they think of their vote for Congress as a vote against Trump, while about half (48%) of Republican and Republican-leaning voters say they think of their vote as a vote for Trump. The share of Republicans and Republican leaners who say their congressional vote is for Trump is higher than the share saying this about Bush in October 2006 but roughly on par with the share of Democrats who considered their 2010 congressional vote as a vote in support of Obama.
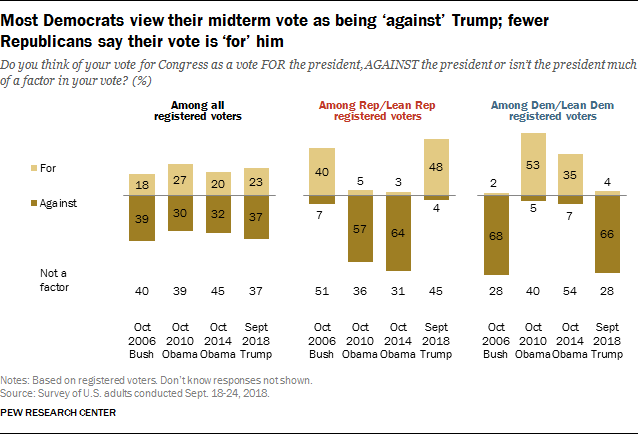 The percentage of Democratic voters who consider their vote for Congress as a vote against the president (66%) is comparable to the percentage of Democrats who considered their 2006 vote as a vote against Bush. It is also similar to the share of Republican voters in 2014 who considered their vote for Congress as a vote against Obama.
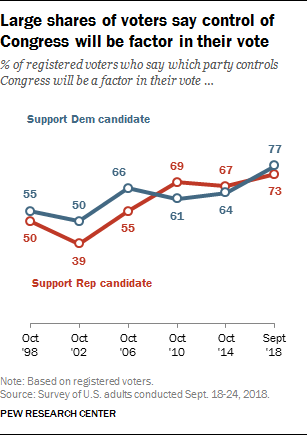 About seven-in-ten voters (72%) say that which party will be in control of Congress is a factor in their vote in November, the highest share saying this in any election over the past two decades. While the share of Republican supporters who say this is only modestly higher than the share saying this in 2010 and 2014, among Democratic supporters, the share who say party control is a factor in their vote is substantially higher than in any prior midterm election dating back two decades.
.
.


