by Alex Gonzalez
These charts are from data in the new Texas Tribune/ University of Texas poll released yesterday. The 839-pages crosstabs poll was conducted from October 30 to November 8 among 1200 Adults who completed the poll. From the 1200 who completed the poll, 270 self-identified as Hispanic.
You can read other findings about this poll here (1, 2, 3) by Ross Ramsey from Texas Tribune on guns, abortion and approval, etc.… My focus is more related directly with Hispanics and their political views in Texas and the upcoming 2016 presidential election.
In Texas, “whites” feels more strongly that Texas is going in the wrong direction while Hispanics and blacks seem to be more optimist about future.
 Overall, Hispanics tends to have a more optimist views about the state. While 30% of Hispanics feel that the state is going in the right direction, only 14.84% of whites feel that way. Black respondents seem to be the happiest subgroup of respondents in Texas. When you look into the ages of those who feel that state is going in the right direction by age, 35% of those 18-29 respondents said they feel the state is in the right direction while only 14% of 65+ feel that way. Moreover, when the question was asked about the wrong direction for the state, 67% of the 65+ said the state is going in the wrong direction while only about 52% of 18-29 felt that way. This pessimistic view is exacerbated when party ideology is factored in with only 11.40% of Republicans saying the state is in right direction and only 1.96% of Tea Party Republicans expressing the same view, whereas 44.71% of Democrats feel the state is going in the right direction.
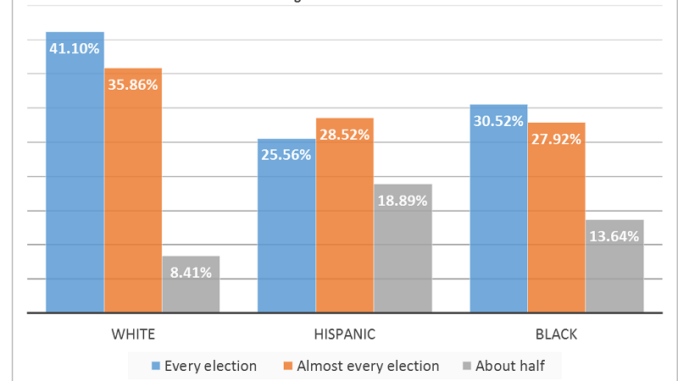
Hispanics tend to have a lower voting pattern than whites.
 Only 25% of Hispanics said they vote in “every election” while 41% of whites and 30% of blacks said they vote on every election. And this an issue that has, politically, wounded Hispanics in Texas for a long time since; even if they register to voter, their “voting habit” is not as consistent as that of whites.
 Hispanics in Texas have set of priorities, sometimes different from other subgroups of voters. While about 10% of Hispanics said border security, and 14% immigration, are the most important issues, education is third on the list with 9% and the economy is about6%. Education consistently ranks among the top issues for Hispanics in Texas and nationwide followed by immigration and the economy/jobs. But immigration means a different thing for Hispanics such border security and immigration reform,whereas for many non-Hispanics, immigration means immigration enforcement and border security only.
The chart above shows that whites in Texas place high priority on border security and immigration. But when examined by party affiliation, those priorities on immigration become more striking among white Republicans.
 Among Republicans in Texas, between border security and immigration, 57% said those are the “most important” issues while education and the economy rank very low in their priority list. Again, when you split the Republicans and Tea Party Republicans, this focus on border security/immigration increases even more among Tea Party voters with about about 70% of Tea Party Republicans responding border security/immigration as the most important issues while education ranks only 0.49% the economy only 1.97%.
Hispanics give low approval to Obama and Congress.
 The combined approval – Approve strongly and Approve somewhat – for Obama among Hispanics is about 47% while the combined approval for Congress is about 14%. The combined disapproval for Congress is about 61% while disapproval for Obama is only about 35%. Furthermore, what this chart shows is party bias among Hispanics, and thus, party affiliation in the state. For example, those who disapprove of Obama most likely are Hispanic Republicans (35%) while those who approve Obama most likely are Democrats (47%).
This party bias can also be seen on how Hispanics responded when asked about party favorability.
 The combined favorability among Hispanics in Texas for the Republican Party is only 25.60% while favorability for Democrats is about 45%. Evidently, those who favor the Republicans (25.60%) – and see Obama very unfavorable/somewhat unfavorable (30%) – most likely are Hispanic Republican voters while those who favor the Democrat party are Democrat voters. What the two previous charts show is that the GOP is stuck with 30-35 of Hispanic support in Texas while Democrats have about 45-50% and about 15-20% with no party preference among Hispanics. And there is more evidences to this trend in this extensive poll.
The chart below show Hispanic approval for top elected of officials who are all Republicans.
 The combined approval for Gov. Greg Abbott is about 34%. This is the same number of Hispanics who “disapprove” the Democrat Party and Obama. Here again we can conclude there is party bias since 36.66% disapprove Abbott’s performance. This chart also shows that the combined approval for Ted Cruz is 34% while combined disapproval is about 39%. Dan Patrick is the elected official with less combined approval with only 23% and with a 33.74% disapproval. Again, this approval for GOP elected official tells where the GOP is among Hispanic voter in Texas.
As Ross Ramsey noted, The poll show that partisan and ethnic differences are deep in Texas. And this ethic partisans views sure will play a role in the the election of 2016 when Tea Party candidates like Trump and Ted Cruz will vie for votes.
More than half agree with this statement: “Undocumented immigrants currently living in the United States should be deported immediately.” While 39 percent disagree, 55 percent agree. Some are more emphatic: 30 percent strongly agree, and 21 percent strongly disagree. Partisan and ethnic differences are deep. While 74 percent of Republicans agree, 64 percent of Democrats do not. Anglos (63 percent) and blacks (54 percent) agree, but Hispanics (58 percent) do not – Ross Ramsey
2016 Republican Presidential Primary Vote Choice:
Only 93 Hispanics answers the Republican presidential primary vote choice. This is also a party bias indication since 133 answered the same question for the Democrat primary vote choice for Hillary Clinton getting more than 60%. Among Republican Hispanics who chose to answered, Ted Cruz received 20 , Ben Carson 14, Jeb Bush 8, Rand Paul 2, Marco Rubio 12, and Donald trump 33.
More poll like this will be generated in 2016. But if similar trend continue among Hispanic voters in 2016 before the presidential, we may be able to have established patterns in Texas about how Latino will vote.
Alex Gonzalez is a political Analyst and Political Director for Latinos Ready To Vote. comments to [email protected] or @AlexGonzTXCA


