After more than a year of Republican presidential candidate Donald Trump making provocative comments about Mexican and Muslim immigrants and Hispanics in general, a new Pew Research Center survey of Hispanics finds their overall attitudes about the Republican and Democratic parties – and levels of political engagement – are not much different than they were four years ago.
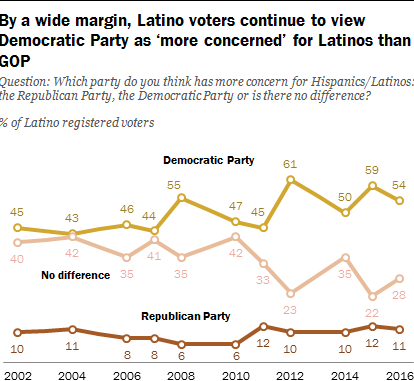
 About half of Latino registered voters (54%) continue to say the Democratic Party is more concerned for Latinos than the Republican Party; just 11% say the GOP has greater concern, while 28% say there is no difference between the parties. Democrats held a similar advantage four years ago, when by 61% to 10%, more Latino voters viewed Democrats as more concerned about Latinos.
Trump’s campaign comments about Hispanics have resonated widely. Fully 75% of Hispanic registered voters say they have discussed the Republican candidate’s comments about Hispanics or other groups with family, friends or coworkers in the past year. And among Hispanic registered voters who have discussed Trump’s comments, 74% say they have given “quite a lot” of thought to the presidential election and 74% say they are “absolutely certain” they will vote.
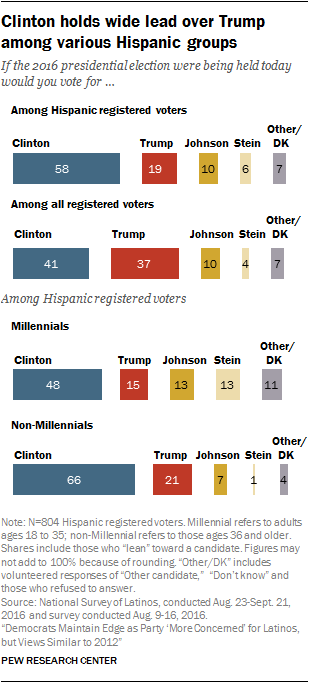 The annual Pew Research Center National Survey of Latinos, conducted from Aug. 23 through Sept. 21, among 1,507 Latino adults, including 804 registered voters, finds that Trump trails by a sizable margin in the presidential race. About six-in-ten Latino registered voters (58%) favor Clinton, while just 19% support Trump; 10% favor Libertarian Gary Johnson while 6% back Jill Stein, the Green Party nominee.
In 2012, in a two-way contest between Barack Obama and Mitt Romney, Obama won 71% of the Latino vote, while just 27% supported Romney, according to national exit polls. That was one of the largest Democratic advantages among Latinos dating back more than two decades, according to a post-election analysis of the Hispanic vote.
Notably, Clinton’s support is lagging among Hispanic Millennials (those ages 18 to 35 in 2016), who will make up nearly half of the record 27.3 million Latinos estimated to be eligible to vote in 2016. Among Hispanic Millennials, 48% support Clinton, while 15% back Trump; about as many favor Johnson or Stein (13% each) and 11% chose another candidate or offered no opinion. Among all older Latino voters (ages 36 and older), Clinton has 66% support, Trump 21% while just 7% back Johnson and 1% support Stein.
In addition, Clinton receives less-positive backing from Latino Millennials who support her than from older Latino voters. About two-thirds (64%) of Millennial Latinos who back Clinton describe their support as more a vote against Trump than a vote for Clinton. By contrast, 65% of older Clinton supporters say their support is more of a vote for her than a vote against Trump.
A similar generation gap in positive voting is seen among Clinton’s supporters more generally. In an August Pew Research Center survey of U.S. adults, most Millennial voters who supported Clinton (62%) said they saw their vote more as a vote against Trump rather than for Clinton. Meanwhile, most older Clinton supporters (57%) viewed their vote more as an expression of support for Clinton.
Mixed signals on voter engagement among Latinos in 2016 compared with 2012
With the number of Latinos eligible to vote reaching a record 27.3 million, Latinos could be more important than ever in the upcoming election. But a big question about the Latino vote is how many will turn out this year given that Latino voter turnout rates have long trailed those of other groups.
 Historically, demographic growth has been a key factor in pushing the Hispanic vote to new highs in turnout and voter registration at least since the 1980s. For example, the number of Hispanic eligible voters is up about 4 million since 2012. As a result, the number of Hispanic registered voters and the number of Hispanic voters is likely to reach new records in 2016, just as it has in every previous presidential election cycle for the past three decades.
Overall, 69% of Latino registered voters say they are “absolutely certain” they will vote this November, down modestly from 77% who said the same in 2012. Among the sharpest declines – 13 percentage points – is among Millennial Latinos. This year, 62% say they are absolutely certain they will vote compared with 74% who said the same four years ago.1
Yet, even though a lower share of Latino registered voters say they are certain to vote than in 2012, engagement with the election is roughly similar. Two-thirds (67%) say they have given “quite a lot of thought” to it in 2016, while in 2012, 61% said the same.
Democrats retain wide advantage in Latino party identification
 Democrats continue to hold a significant lead over Republicans in political party identification among Latino registered voters. About two-thirds (64%) of voters say they identify with or lean toward the Democratic Party while 24% say the same about the Republican Party.
There has been little change over the past 15 years in the share that identifies as Republican among Hispanic registered voters. In 1999, 25% identified with or leaned toward the Republican Party. Meanwhile, Democrats have made gains during this time, with the share identifying with or leaning toward the Democratic Party rising from 57% in 2007 to 70% in 2012, and holding relatively steady since then. Both trends predate the candidacy of Trump.
This report is based on a nationally representative bilingual telephone survey of 1,507 Latino adults, including 804 registered voters, conducted from Aug. 23 through Sept. 21, 2016, by SSRS for Pew Research Center. The survey was administered via landline and cellphone in all 50 states and the District of Columbia and was fielded before the first presidential debate. The margin of sampling error for the full sample is plus or minus 3.3 percentage points at the 95% confidence level; for registered voters, the margin of sampling error is plus or minus 4.6 percentage points.
Among the survey’s other findings:
Dissatisfaction with the nation’s direction rises
- The share of Hispanic registered voters who are dissatisfied with the nation’s direction has risen from 50% in 2012 to 57% in 2016.
- Among U.S.-born Hispanic registered voters, 63% are dissatisfied with the nation’s direction, a higher share than the 45% of immigrants who say the same.
Top issues for Latino registered voters in 2016
- On the issues that will determine their vote this year, Latino registered voters say education, the economy and health care are the most important. Fully 83% say the issue of education will be “very important” to their vote in 2016, 80% say the same about the economy and 78% say the same about health care.
- The issue of immigration ranks lower, with seven-in-ten Latino registered voters saying it will be “very important” to determining their vote this year.
Voting and registering to vote
- Fully 97% of Hispanic registered voters say they have the identification needed to vote in their state. Among Hispanic eligible voters who are not registered to vote, 85% say the same.
- One-in-five Hispanic registered voters will be voting for the first time this election.
- Some 15% of Hispanic eligible voters say they will not vote this year. Among them, 33% cite dislike of the candidates as their reason for not voting. Another 22% say they are not interested in the election or feel that their vote will not make a difference.
Differences between Clinton and Trump supporters
- About eight-in-ten (83%) Latino voters who support Trump were born in the U.S., compared with 64% who were U.S. born among Latino voters who back Clinton.
- Among Latino voters, 37% of Clinton supporters are English dominant, 22% are Spanish dominant and 41% are bilingual. By comparison, 60% of Latino voters who back Trump mainly use English, while 5% mainly use Spanish and 35% are bilingual.
- About two-thirds (67%) of Latino voters who support Trump have some college education or more, compared with 54% of Latino voters who support Clinton. Among Latino voters, those who have not completed high school make up 9% of Trump supporters and 22% of Clinton supporters.
- Among Latino voters who support Clinton, 33% describe their political views as liberal, while 37% say they are moderate and 28% say they are conservative. Among Latino voters who back Trump, 6% describe their views as liberal, compared with 30% who say they are moderate and 60% who say they are conservative.

